|

|
|
Mulvane Cooperative
Cash Bids
Market Data
News
Ag Commentary
Weather
Resources
|
How Is Home Depot's Stock Performance Compared to Other Home Construction Stocks?/Home%20Depot%2C%20Inc_%20location%20by-hapabapa%20via%20iStock.jpg)
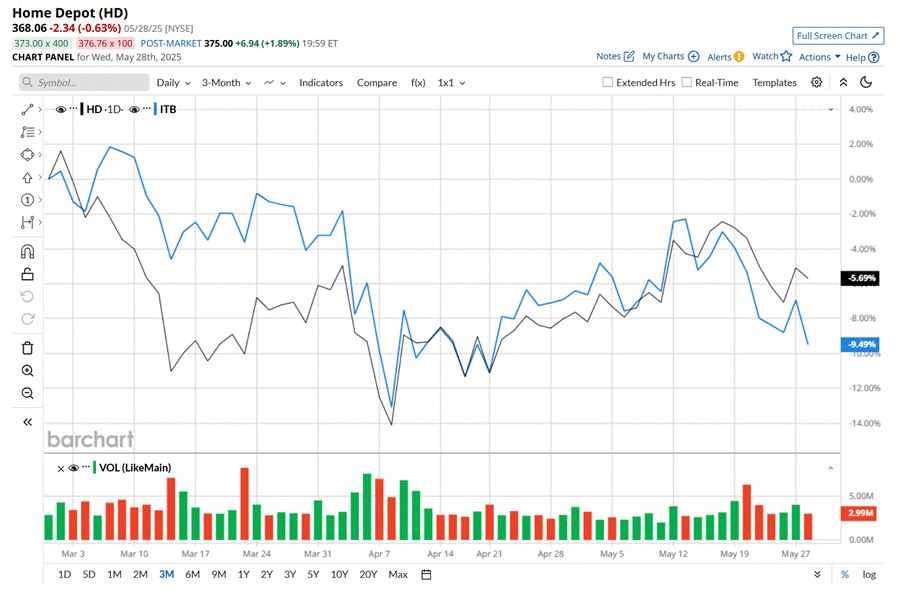
Valued at a market cap of $365.9 billion, The Home Depot, Inc. (HD) is a leading home improvement retailer that offers a wide range of products, including building materials, home improvement items, lawn and garden supplies, décor products, and maintenance, repair, and operations (MRO) products. The Atlanta, Georgia-based company serves both DIY customers and professional contractors through its extensive network of stores as well as a strong online presence. Companies worth $200 billion or more are typically classified as “mega-cap stocks,” and HD fits the label perfectly, with its market cap exceeding this mark, underscoring its size, influence, and dominance within the home improvement retail industry. As one of the world’s largest home improvement retailers, HD benefits from extensive economies of scale and a well-established supply chain. Its strength lies in its massive scale, broad product selection, and strong brand reputation. Its robust omnichannel strategy, including a user-friendly e-commerce platform and in-store pickup options, enhances customer convenience. Additionally, its deep industry expertise, professional services, and strategic acquisitions give it a competitive edge in both consumer and commercial markets. This home improvement giant has dipped 16.2% from its 52-week high of $439.37, reached on Nov. 26, 2024. It has fallen 7.2% over the past three months, outpacing iShares U.S. Home Construction ETF’s (ITB) 9.9% loss over the same time frame. 
In the longer term, HD has rallied 12% over the past 52 weeks, considerably outpacing ITB’s 14% drop over the same time frame. Moreover, on a YTD basis, shares of HD are down 5.4%, compared to ITB’s 13.9% decline. To confirm its recent bullish trend, HD has been trading above its 50-day moving average since early May. However, HD has remained below its 200-day moving average since early March. 
On May 20, shares of HD closed down marginally after its mixed Q1 earnings release. The company’s revenue of $39.9 billion improved 9.4% from the year-ago quarter and surpassed the consensus estimates. Moreover, customer transactions grew 2.1% year-over-year, reaching $394.8 million. Steady engagement in its smaller projects and successful spring events benefited the company. However, its comparable sales decreased marginally from the same quarter last year. Additionally, on the earnings front, its adjusted operating margin contracted by 90 basis points, resulting in a 3% year-over-year decline in its adjusted EPS of $3.56. The bottom line also fell short of the analyst expectations. The company’s performance was weighed down by elevated interest rates and ongoing macroeconomic uncertainty, which limited home sales and home improvement projects, softening demand for its products. Looking ahead, Home Depot reaffirmed its fiscal 2025 guidance, projecting total sales growth of approximately 2.8%, while expecting adjusted EPS to decline by about 2% compared to fiscal 2024. HD’s outperformance looks pronounced when compared to its rival, Lowe's Companies, Inc.’s (LOW) 4.3% rise over the past 52 weeks and 9% drop on a YTD basis. Looking at HD’s recent outperformance, analysts remain highly optimistic about its prospects. The stock has a consensus rating of “Strong Buy” from the 35 analysts covering it, and the mean price target of $420.26 suggests a 14.2% premium to its current price levels. On the date of publication, Neharika Jain did not have (either directly or indirectly) positions in any of the securities mentioned in this article. All information and data in this article is solely for informational purposes. For more information please view the Barchart Disclosure Policy here. |
|
|