|

|
|
Mulvane Cooperative
Cash Bids
Market Data
News
Ag Commentary
Weather
Resources
|
Will Silver Ever Break to the Upside?
I asked if silver was back on a bullish path in an April 17, 2025, Barchart article. I concluded that:
Nearby COMEX silver futures were at $32.985 per ounce on April 16 and was higher in late May 2025. However, the trend remains bullish, and silver can potentially surprise on the upside over the coming months. Silver’s technical trend is bullishSilver’s long-term path of least resistance remains bullish in late May 2025. 
The seven-year continuous monthly COMEX silver futures chart highlights that the precious metal has made higher lows and higher highs since finding a bottom at the March 2020 low of $11.64 per ounce. Silver’s most recent high of $35.495 in March 2025 was the highest price since March 2012. Silver’s deficit means fundamentals agree with technicalsIn its April annual silver survey, The Silver Institute forecast 2025 silver supplies at 1.0306 billion ounces, with total demand at 1.148.3 billion ounces. The 117.70 million ounce fundamental deficit was the fifth consecutive year where demand outstripped supplies. Each year, investment and speculative demand are crucial for the path of least resistance of silver prices. Given the bullish technical trend, the fundamental data supports a continuation of higher highs for the silver price. Moreover, the next upside technical target is the early 2012 $37.58 peak, which could be a gateway to a challenge of the 2011 $49.82 high and the 1980 record peak of $50.32 per ounce. A move over the $37.58 level could unleash a herd of buyers in the silver market. Relative value- The silver-gold ratio says silver is inexpensiveThe silver-gold ratio has been a relative value indicator for centuries, first proclaimed by the Egyptian Pharoah Menes, who died in 3125 BC. Menes declared that two and a half parts of silver equal one part of gold. 
The thirty-year chart of the price of the continuous COMEX gold futures contract divided by the continuous COMEX silver futures contract ({GCM25}/{SIN25}) shows that the silver-gold ratio has been as low as 31.662:1 in 2011 when silver traded to nearly $50 per ounce, and as high as 124.648:1 in 2020 when silver fell to the $11.64 per ounce bottom. While the ratio has been trending higher since the 2011 low, it remains historically high. The relative value metric tells us that silver is inexpensive compared to gold at current prices. The gold market has received lots of press as the price has risen to record highs in 2024 and 2025, while silver prices remain substantially below the record peak. However, market participants seeking value in the precious metals could turn to silver over the coming weeks, months, and years, as gold prices have experienced a parabolic rally. Buying on weakness has been optimal since 2020The seven-year monthly silver chart highlights that every significant downside correction in silver, including the 2020 low that led to the $11.64 bottom, has been a golden buying opportunity. At the most recent $35.495 2025 high, silver had over tripled from the 2020 low. The most recent example was the April 7 risk-off lows created by the Trump administration’s April 2 “Liberation Day” announcement that rolled out unprecedented tariffs on trading partners to level the playing field. 
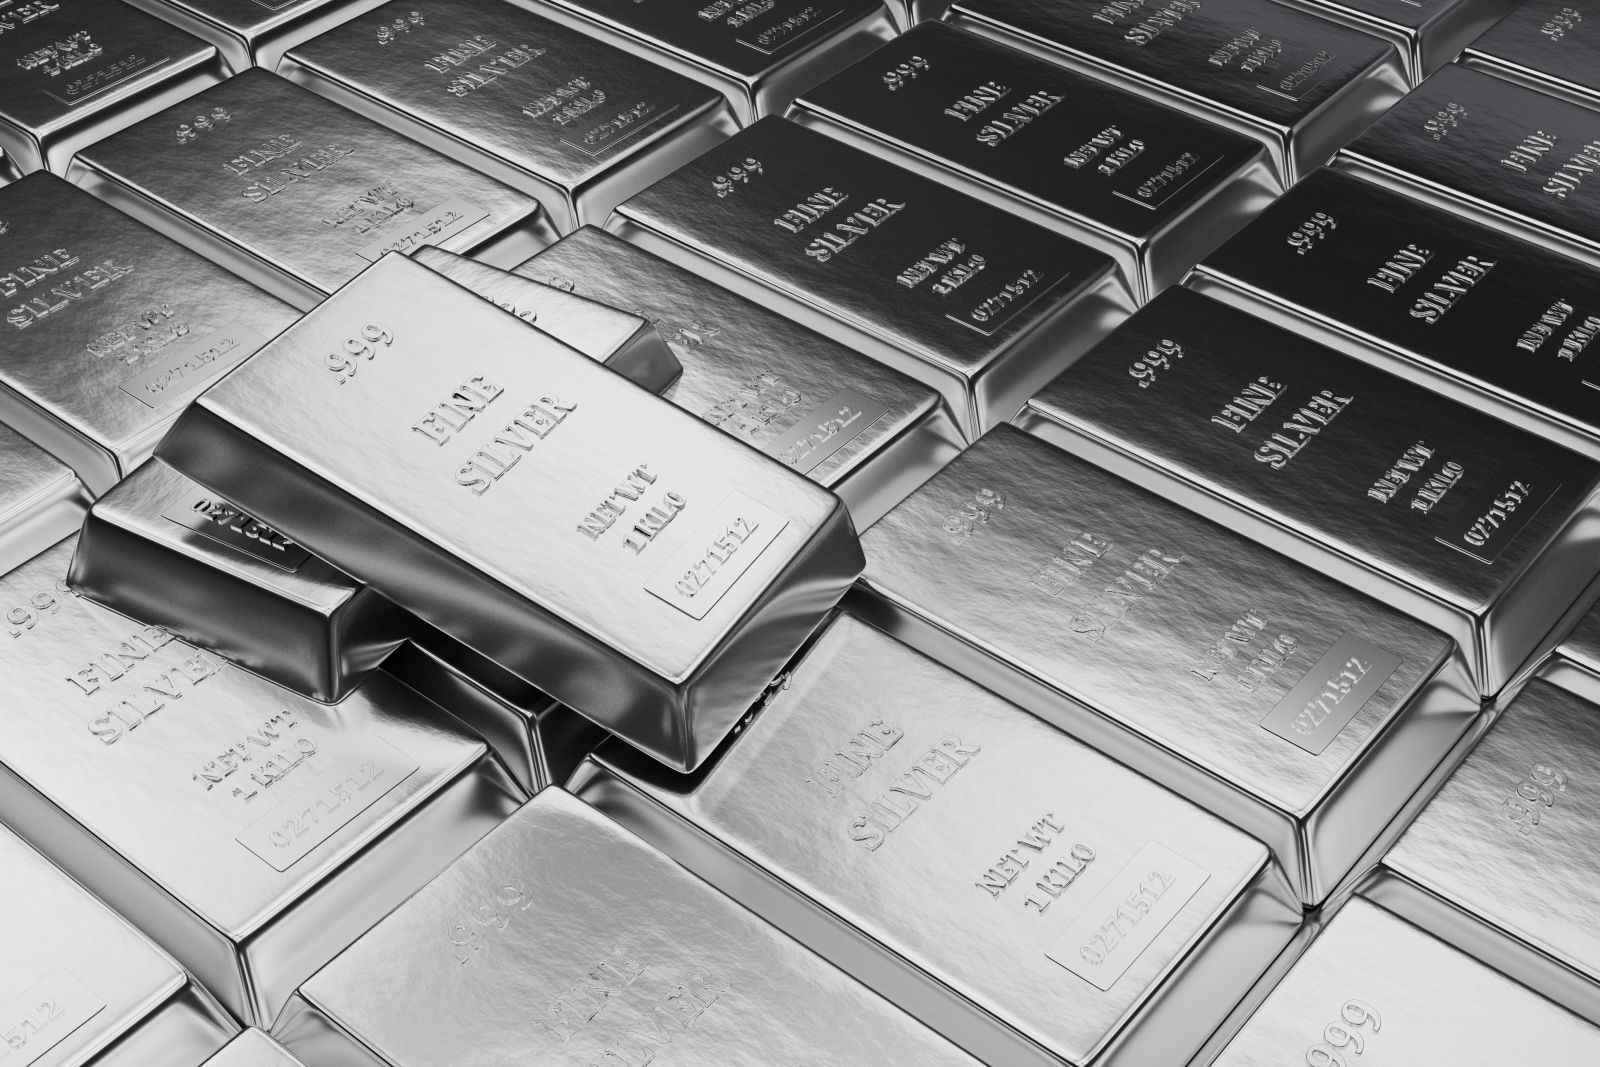
The daily chart of July COMEX silver futures shows the spike to a $27.845 per ounce April 7 low, a golden opportunity for silver accumulation. The price moved over $6 higher sixteen days later on April 23, 2025. Buying silver on price weakness has been optimal over the past years. SLV is the most liquid silver ETF productThe most direct route for a long risk or investment position in silver is the physical market for bars and coins. However, silver is a bulky commodity, inhibiting self-storage, and third-party storage involves insurance and vaulting expenses. Moreover, independent dealer’s bid-offer spreads on physical silver tend to be far wider than in the COMEX futures or London wholesale silver market. While the futures provide a physical delivery mechanism, they involve margin, creating leverage. The most liquid silver ETF product is the iShares Silver Trust (SLV), which invests its considerable assets in allocated and unallocated silver bullion. At $30.45 per share, SLV had over $14.75 billion in assets under management. SLV trades an average of over 14.75 million shares daily and charges a 0.50% management fee. The most recent rally in silver futures for July delivery took the price 22.16% higher from $27.845 on April 7 to a high of $34.015 on April 25. 
Over around the same period, SLV rose 15.24% from $26.57 to $30.62 per share. The reason for SLV’s underperformance is that the silver ETF can miss highs or lows when the stock market is closed, as the volatile silver futures trade around the clock. With silver over the $32 per ounce level, the critical upside target is the $37.58 technical resistance level. Silver’s relative value versus gold, the fundamental deficit, and the path of least resistance of silver prices since the 2020 low all point to a break above the resistance and a challenge of the 2011 and 1980 highs. However, buying on price weakness will likely remain optimal in the volatile silver market. On the date of publication, Andrew Hecht did not have (either directly or indirectly) positions in any of the securities mentioned in this article. All information and data in this article is solely for informational purposes. For more information please view the Barchart Disclosure Policy here. |
|
|